Five charts that help you stay calm as markets jitter
At one stage in April, the global stock market (MSCI ACWI index) had slumped nearly 20% in dollar and sterling terms, slightly more in euro terms. This followed the initial announcement of US tariffs on what the Trump administration called "Liberation Day".
Amidst tariff wars and geopolitical turmoil, many battered and bruised investors were tempted to sell. As we enter a renewed period of market jitters, many will be feeling nervous once again.
But what happened after the April sell-off serves as a powerful reminder of the risks investors face if they try to time the market. The stock market quickly recovered its losses before continuing to rally to new all-time highs. By late October, it was up 36% in dollar terms from the lows. Anyone who sold will be rueing that decision.
Now in November, once again, the market is showing signs of unease. The market’s fear gauge, the Vix index, has risen and share prices have fallen back
Before continuing, it is worth putting this latest bout of stress into context. The stock market isn’t down even 5% from its latest all-time high, but that doesn’t change the nerves many people are already feeling.
We can’t alter the emotional response but what we can do is provide some objective, data-driven, analysis which may help you shift from a knee-jerk reaction to a more logical and reasoned one.
1: 10%+ falls happen in more years than not, and 20% falls happen roughly every four years
This year’s volatility has felt scary, but it’s worth putting that in a longer-term context. It is nothing out of the ordinary. The market has fallen by 10% or more in 31 of the past 54 years (including 2025). And it has fallen by 20% or more in 13 of these years.

The risk of short-term loss is the price of entry for the long-term returns that the stock market has delivered.
2: Stock market investing is very risky in the short run but less so in the long run – unlike cash
While short-term declines are stress-inducing, for most investors, what matters more should be the risk of not achieving their long-term financial goals. These vary but, as a minimum, most investors at least want their money to keep pace with inflation.
This is where stocks have historically shone, whereas seemingly safer investments like cash have struggled. In the short-run, cash and stocks have a similar track record of beating inflation. Both have managed it around 60% of the time, failing to do so a sizable 40% of the time.
But the longer the investment horizon, the more likely it has been for stocks to outperform inflation, while cash’s odds have stayed low. As a result you can argue that cash has been riskier than stock market investing when it comes to beating inflation in the long-run.

3: Being spooked by volatility could cost you in the long run
The Vix index, a measure of the amount of volatility investors expect from the S&P 500 index over the next 30 days, is often called the market’s "fear gauge".
As recently as 27 October it was giving the all-clear signal on a level of 15, below the historical average of 19. But it shot up as high as 28 on Friday 21 November.
The question for investors is whether they should take a heightened fear gauge like this as a sign to sell their stocks. Historically, the answer has been a resounding no.

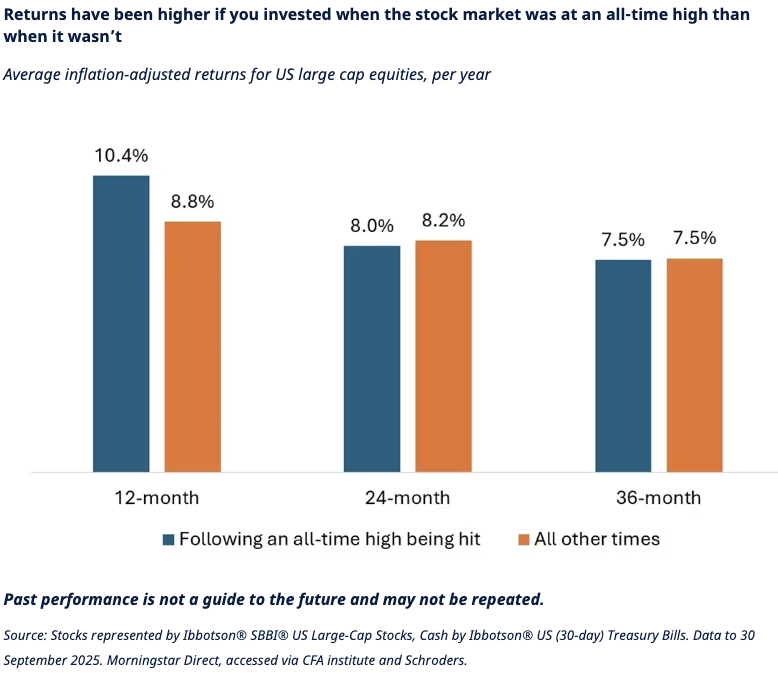
4: Don’t fret about the market being near all-time highs
Investing 101 is that you should buy low and sell high. It is therefore perfectly reasonable for investors to feel concerned if the market is at or near an all-time high. But should they?
The conclusion from our analysis of stock market returns since 1926 is unequivocal: no.
On average, 12-month returns following the point at which an all-time high is hit have been better than at other times: 10.4% ahead of inflation compared with 8.8% when the market wasn’t at a high. Returns on a two or three-year horizon have been similar, regardless of whether the market was at an all-time high or not.
While this initially feels counterintuitive, it makes sense when you reflect that the market has gone up over time, and so has been at an all-time high on a regular basis. Of the 1,197 months since January 1926, the market was at an all-time high in 368 of them – or 31% of the time.
We can also look at the long-term cost of being scared off if the market hits an all-time high. The table below shows how $100 invested in the US stock market would have grown over various time horizons to 30 September 2025, in inflation-adjusted terms. It also shows what would have happened if, instead of staying invested, you switched out of stocks and into cash whenever the market was at an all-time high, and you went back into stocks whenever it wasn’t. This would have cost you big time. And that’s before we even take account of transaction costs.

There may be valid reasons to worry about stocks but the market being at all-time high should not be one of them.
5: There is always a reason to worry but, in the long-run, stocks have beaten bonds which have beaten cash
While the past is not necessarily a guide to the future, history suggests that those who responded to market risk with knee-jerk reactions often missed out. Increasing risks around the world – from geopolitical instability to trade uncertainty – can make investors uneasy, but for long-term investors, staying calm and disciplined, and sticking to your plan, is often the most effective approach.

Important information
This communication is marketing material. The views and opinions contained herein are those of the named author(s) on this page, and may not necessarily represent views expressed or reflected in other Schroders communications, strategies or funds.
This document is intended to be for information purposes only and it is not intended as promotional material in any respect. The material is not intended as an offer or solicitation for the purchase or sale of any financial instrument. The material is not intended to provide, and should not be relied on for, accounting, legal or tax advice, or investment recommendations. Information herein is believed to be reliable but Schroder Investment Management Ltd (Schroders) does not warrant its completeness or accuracy.
The data has been sourced by Schroders and should be independently verified before further publication or use. No responsibility can be accepted for error of fact or opinion. This does not exclude or restrict any duty or liability that Schroders has to its customers under the Financial Services and Markets Act 2000 (as amended from time to time) or any other regulatory system. Reliance should not be placed on the views and information in the document when taking individual investment and/or strategic decisions.
Past Performance is not a guide to future performance. The value of investments and the income from them may go down as well as up and investors may not get back the amounts originally invested. Exchange rate changes may cause the value of any overseas investments to rise or fall.
Any sectors, securities, regions or countries shown above are for illustrative purposes only and are not to be considered a recommendation to buy or sell.
The forecasts included should not be relied upon, are not guaranteed and are provided only as at the date of issue. Our forecasts are based on our own assumptions which may change. Forecasts and assumptions may be affected by external economic or other factors.
Issued by Schroder Unit Trusts Limited, 1 London Wall Place, London EC2Y 5AU. Registered Number 4191730 England. Authorised and regulated by the Financial Conduct Authority.